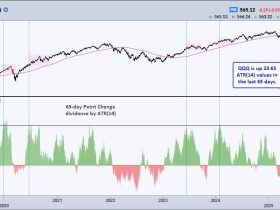
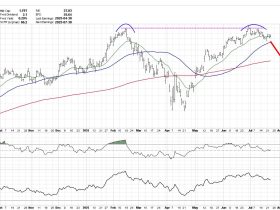
Joe kicks off this week’s video with a multi‑timeframe deep dive into the 10‑year U.S. Treasury yield (TNX), explaining why a sideways coil just below the 5% level could be “downright scary” for equities. From there, he demonstrates precise entry/exit timingwith a combination of ADX, MACD, and RSI. Joe also covers the short-term divergence developing in the QQQ, takes a look at the IWM, and wraps up with some analyses of this week’s viewer symbol requests, including INTC, MU, and more.
The video premiered on June 11, 2025. Click this link to watch on Joe’s dedicated page.
Archived videos from Joe are available at this link. Send symbol requests to stocktalk@stockcharts.com; you can also submit a request in the comments section below the video on YouTube. Symbol Requests can be sent in throughout the week prior to the next show.


